Important Notice: SprayWise Decisions will be closing July 31st 2024
 Download Help PDF
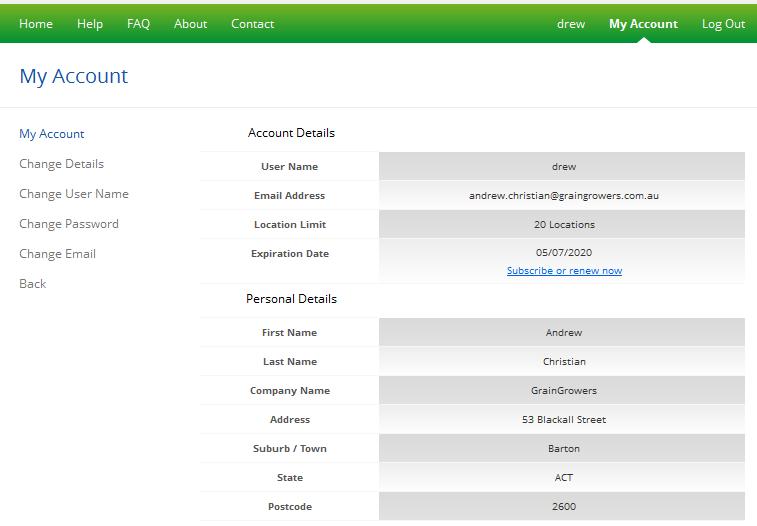
Once registered, users can view their account details at any time and change information as required. Users have the option to change any of the following details relating to their account:
Users can setup their account with a number of points with which Spraywise uses to determine Delta T, weather forecasts and recent weather conditions. Depending on the subscription level, the Standard Subscriber is entitled to 4 points that can be placed anywhere within Australia and the Corporate Subscriber is entitled to 20 points.
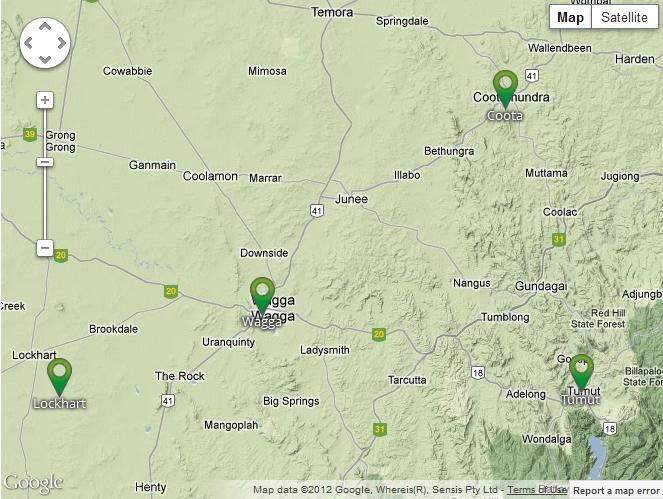
Spraywise Decisions uses the Google Maps interface to effectively locate each point on the map. The viewer provides the ability to navigate simply to any location within Australia (See Image Below).
The viewer can be displayed as either Map view (default) or Satellite view by clicking on the corresponding buttons in the top right of the viewer window.
Users can add details such as street address, suburb, town and state into the Search bar to zoom to the designated location.
Users can navigate around the viewer by using the viewer tools or by using the mouse.
Click the + sign in the left side of the viewer to zoom in to an appropriate resolution, or, place the mouse cursor over the point of interest on the map and scroll the mouse wheel forward.
Click the – sign in the left side of the viewer to zoom out to an appropriate resolution, or, place the mouse cursor over the point of interest on the map and scroll the mouse wheel backwards.
Click the desired pan arrow in the top left of the viewer to navigate around the image, or using the mouse, click and hold on the map and drag to the desired location.
Users can easily add locations for where they would like to monitor localised weather conditions. The process of adding, editing and deleting locations can only be done via the Home page.
To quit viewing the Locations page and viewer, click the home button in the top banner.
To start viewing weather information relating to each of the locations you have setup, simply click on the desired location and the Spray Planner will automatically load the forecasted details for that location.
The Spray Planner provides a point specific assessment of the prevailing weather conditions for the forthcoming five days at one hour intervals. This is displayed as a traffic light system which identifies suitable conditions for spraying based on the Delta T calculation. This calculation takes into consideration surface temperature and relative humidity and provides an industry standard Delta T temperature value determining how suitable the conditions are for spraying.
Please note that all spraying activities require actual in-field observations to be tested prior to commencing spraying. Spraywise Decisions forecast information provides a guide only and does not signify actual measurements.
Depending on the spray quality identified by the user, the Delta T calculation differs slightly. Users can specify the spray quality type from the selector box at the top of the table and the Delta T will automatically adjust the Spray Planner accordingly. The major point of difference between the spray quality selection is the point at which spraying should not be conducted. Below is a table outlining the Delta T parameters with regards to spray quality.
| Spray Planner Notation | Spray Quality – Delta T (°C) | ||
|---|---|---|---|
| Spray Action | Symbol | Medium or Finer | Coarse or Greater |
| Go | Between 2 and 8 | Between 2 and 8 | |
| Caution | 0 - 2 or 8 - 12 | 0 - 2 or 8 - 12 | |
| Stop | Greater than 10 | Greater than 12 | |
Other spray risk factors are highlighted in the Spray Planner including frost, wind, rain and the possibility for inversions to occur based on localised weather predictions. These risks are displayed in the Spray Planner as symbols for each hour on the Spray Planner, local sunrise and sunset times have been attributed to provide users with a guide of when spraying operations should be commenced or ceased accordingly (See Image Below).
The Spray Planner can be easily printed or exported as a PDF file or emailed to a specified recipient. Click on the Export icon in the top right corner of the Spray Planner page. You will need Adobe Reader to view these files. Click on the link to download a version for your computer http://get.adobe.com/reader/.

The Spraywise Weather Forecast page provides a three hourly prediction for a number of weather parameters specific to your chosen location within Australia. FluroSat utilises an internationally accepted climate forecasting model which predicts a variety of climate parameters. The 14 day predictions displayed in the weather forecast consists of two different models.
Rainfall: The predicted rainfall in millimetres for the selected location.
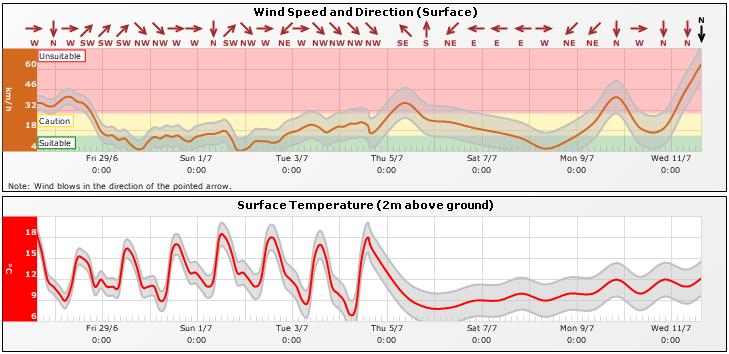
Wind Speed and Direction (Surface): The predicted wind speed in kilometres per hour and associated direction the wind is coming from based on the selected location.
Surface Temperature (2m above ground): The predicted surface temperature 2 meters above the ground surface in degrees Celsius based on the selected location.
Relative Humidity: The predicted percentage measure of how much moisture will be in the air compared to what the air can ‘hold’ at the predicted temperature for the given time interval at the selected location.
Daily Evapotranspiration: The predicted (or potential) evapotranspiration is the maximum continual loss of water by evaporation and transpiration at a given temperature, given a sufficient supply of water.
Delta T: Refers to the atmospheric conditions (or evaporative potential) that affects droplet lifetime once sprayed. It is the predicted measure in degrees Celsius calculated by subtracting the wet bulb temperature from the dry bulb temperature (please refer to Delta T graphic below).
The weather forecast information is displayed as meteograms which are a graphical view of meteorological variables such as rainfall, wind speed, temperature, relative humidity and evapotranspiration. The combination of surface temperature and relative humidity are used to calculate the Delta T for the coming 14 day period. The data can also be viewed in table format outlining exact values for the specified time period. This can be selected by the table/chart drop down list at the top of the page.
The time period for the forecasted weather information can be changed depending on the outlook period requirement. The drop down list at the top of the Forecast Page enables users to select 3, 5, 7, 10 or 14 day outlook periods in which the data is displayed.
The wind speed, temperature, relative humidity and Delta T meteograms all contain a level of error with the predictions. This is shown on the meteogram by the shaded grey area above and below the plotted line (See Image Below). Please note that the level of error is greater during the 7-14 day forecast period.
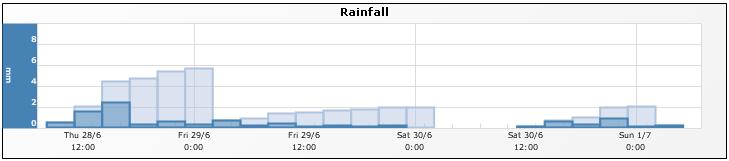
The rainfall meteogram shows the forecasted rainfall for the 3 hour period depicted as the dark blue bar on the chart. The shaded blue is the accumulation of rainfall for the 24 hour period until 12am (See Image Below). Predicted rainfall events greater than 1mm over a 3 hour period are displayed as a rain risk parameter on the Spray Planner.
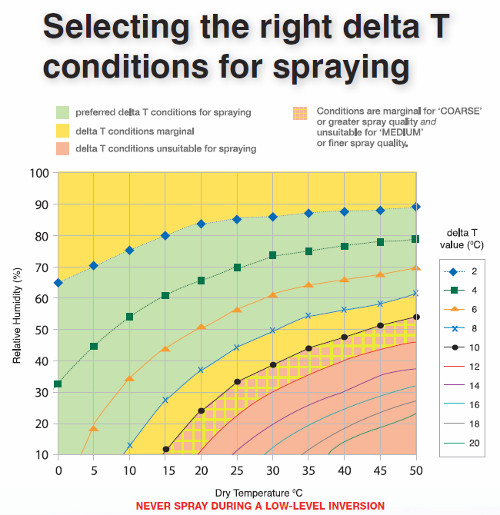
Delta T is an industry standard indicator for determining suitable spray conditions. Delta T is calculated by subtracting the wet bulb temperature from the dry bulb temperature. Delta T values are displayed in degree Celsius (oC) units.
The diagram below shows the relative association between air temperature and relative humidity to values of Delta T.
The information displayed in the Weather Forecast meteogram can be easily printed or exported to pdf format. You will need Adobe Reader to view these files. Click on the link to download a version for your computer http://get.adobe.com/reader/.
The Recent Weather page provides daily observations for the past 14 days over the users selected location. Daily station based observations are sourced from the Bureau of Meteorology (BOM) and FluroSat uses an internationally recognised interpolation method taking into consideration topographical variations to create 1 square kilometre grids covering Australia for each weather parameter to enable any point to be queried and assessed. It is these grids which provide the notion of “virtual weather station in your backyard” even though your closest bureau weather station may be some distance away.
Rainfall: The measure of rainfall in millimetres over the 24 hour period from 9 a.m. of the reported day to 9 a.m. of the following day.
Temperature High: The measure of the maximum temperature in degrees Celsius over the 24 hour period from 9 a.m. of the reported day to 9 a.m. of the following day. Due to processing requirements, this information is generally not available in Spraywise until after 4pm the following day.
Temperature Low: The measure of the minimum temperature in degrees Celsius over the 24 hour period from 9 a.m. of the reported day to 9 a.m. of the following day.
Relative Humidity: The percentage measure at 9 a.m. of the reported day of how much moisture is in the air compared to what the air can ‘hold’ at that temperature.
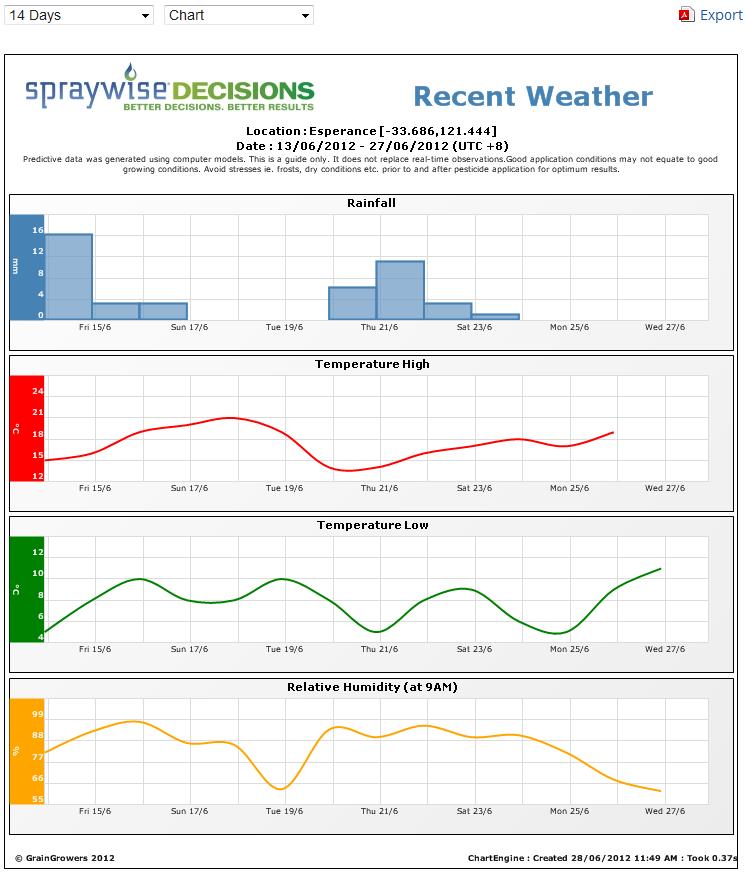
Recent weather details are also displayed in the Meteogram charts similar to the Weather Forecast. Recent weather parameters include daily rainfall, maximum temperature, minimum temperature and relative humidity at 9am. This enables users to assess previous weather conditions that have occurred over the selected locations (See Image Below).
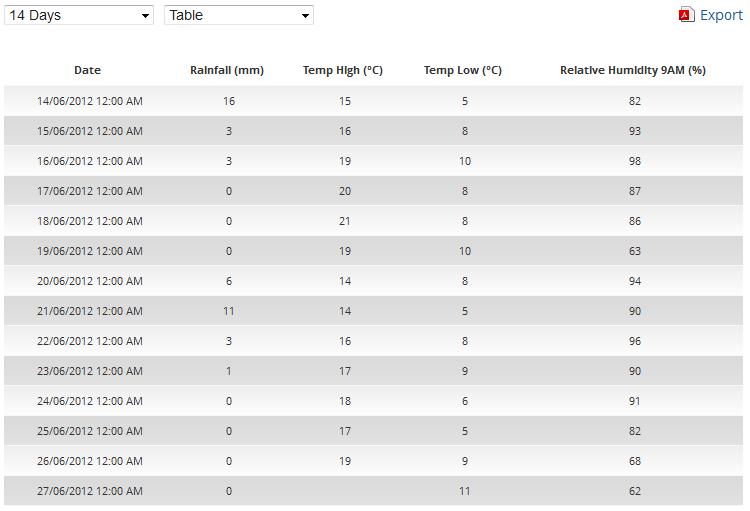
Users can also view the daily recent weather observations of a selected location as table format. Users can select the period they wish to view recent weather details ranging from 3 days back to 14 days. Select table from the Chart/Table drop down list to view all parameters. All parameters are up to date with the exception of maximum temperature which is not available as per the details specified below (See Image Below).
This is a measurement of the maximum temperature for the 24 hour period leading up to the observation, and is recorded as the maximum for the previous day. Due to processing requirements, this information is generally not available in Spraywise until after 4pm the following day.
The information displayed in the Recent Weather meteogram can be easily printed or exported to pdf format. You will need Adobe Reader to view these files. Click on the link to download a version for your computer http://get.adobe.com/reader/.
Spraywise Decisions also enables users to compare climate parameters for the current season relative to historic observations back to 1955. The Similar Seasons page compares climatic parameters such as rainfall, growing degree days, minimum temperature and maximum temperature for the Local Government Area (LGA) that the selected point falls within. This information is expressed at the top of the Similar Seasons chart.
The current season is compared back in history to enable users to find the most similar seasons based on the previous six months pattern and accumulated value for that parameter. Users can see how these previous years progressed and what the final outcomes were at the end of the six month rolling period.
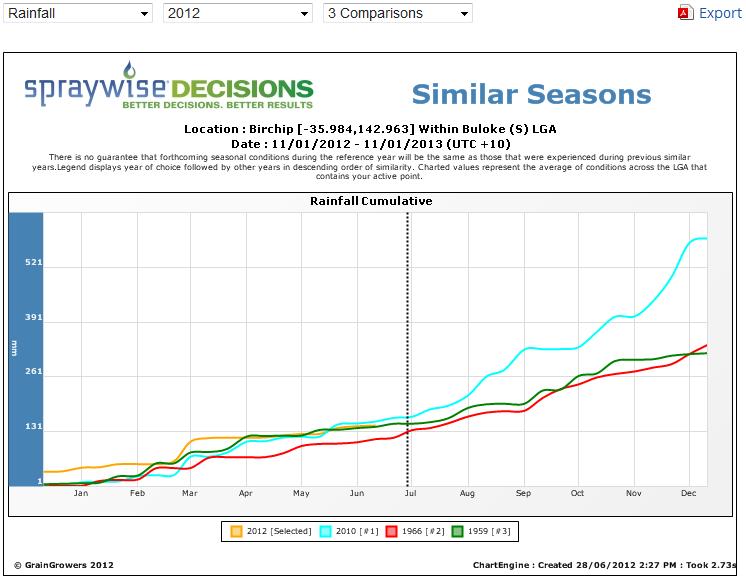
Users can also change the reference year to which the comparisons are based on. Any year from the current year back to 1955 can be chosen. The default number of seasonal comparisons shown on the chart is 3 and users can view 1 through to 5 comparisons by selecting from the drop down list for any listed parameter for any selected reference year.
Rainfall: The cumulative rainfall in millimetres for the LGA in which the selected location falls for six months prior to the current date.
Degree Days: The cumulative growing degree days greater than or equal to 10 degrees Celsius for the LGA in which the selected location falls for six months prior to the current date.
Max Temperature: The observed maximum temperature in degree Celsius for the LGA in which the selected location falls for six months prior to the current date.
Min Temperature: The observed minimum temperature in degree Celsius for the LGA in which the selected location falls for six months prior to the current date.
The information displayed in the Similar Seasons chart can be easily printed or exported to pdf format. You will need Adobe Reader to view these files. Click on the link to download a version for your computer http://get.adobe.com/reader/.
The Radar page provides a number of regional and national meteorological maps for the user’s reference to assess recent atmospheric conditions. These include Local Radar, National Radar, National Cloud and National Synoptic maps. The individual images represent a time sequence providing the last 10 images available from the Bureau of Meteorology (BOM). The local radar view with a radius of 256km is automatically selected depending on the location of the selected point (See Image Below).
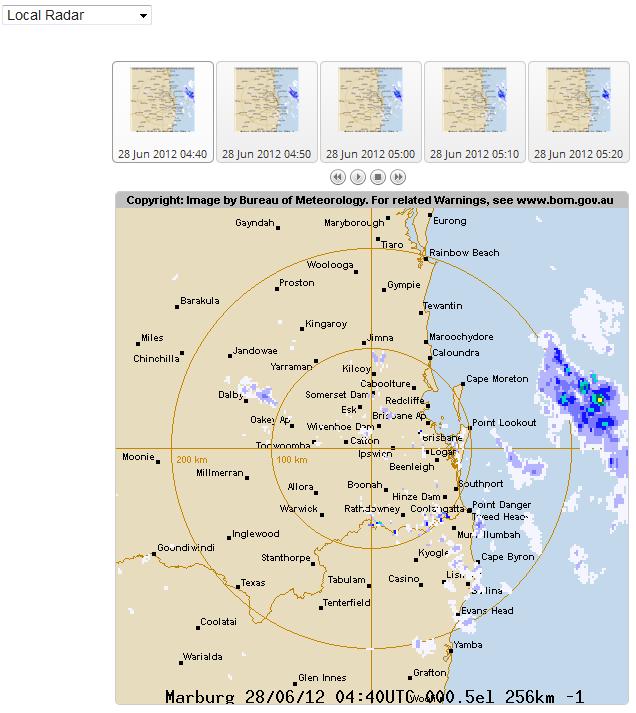
Each of the images can be viewed individually or as an animated sequence. Users can scroll through the images by using the step left and step right buttons. Alternatively, the images can be viewed as an animated sequence by clicking the play button. To stop the animated sequence, click on the stop button.
NOTE: All meteorological images displayed on the Radar page are represented in Coordinated Universal Time (UTC). See table below for conversions based on Australian time zones.
| Region | UTC Conversion (Non Daylight Savings) |
|---|---|
| WA | UTC +8hrs |
| NT, SA | UTC +9hrs |
| QLD, NSW, VIC, TAS | UTC +10hrs |
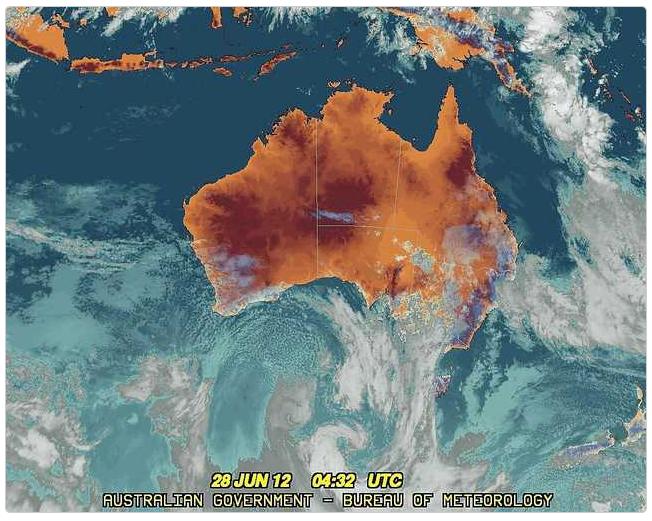
An Example of the Spraywise Decisions national cloud map
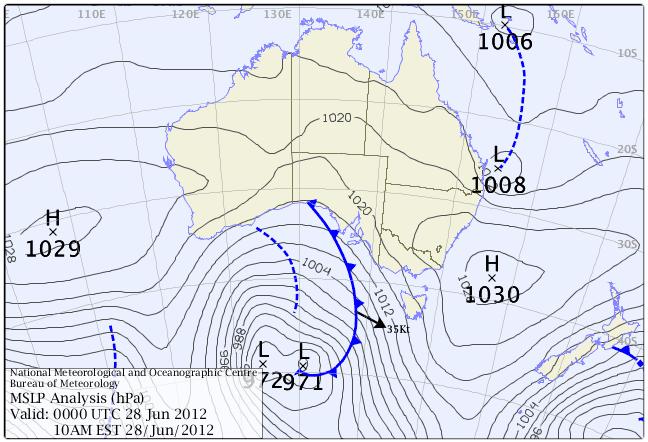
An example of the Spraywise Decisions national synoptic map
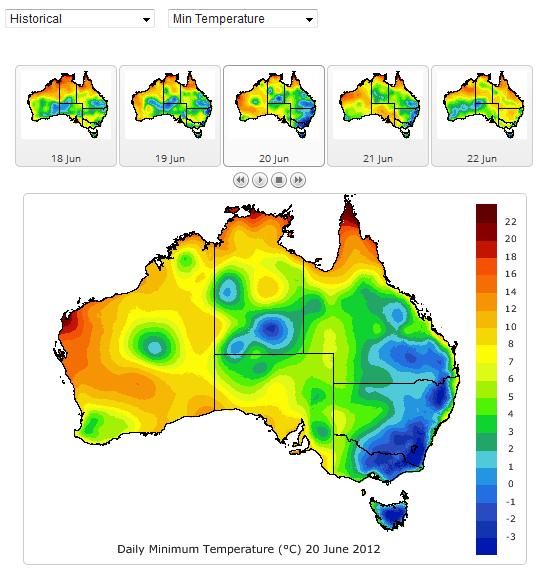
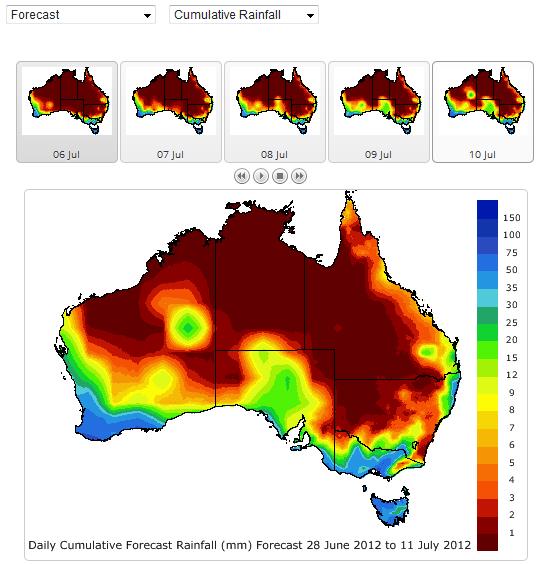
The Maps page of Spraywise Decisions provides users the ability to view the 14 day recent weather and 14 day forecasted weather parameters at national scale. These images are updated daily to provide a national assessment of weather conditions and are the fundamental data layers which drive the Spraywise Decisions support tools. Changing the locations in your account does not affect the Maps Page.
Users can select between recent weather maps and forecast maps by selecting the appropriate parameter from the drop down list. Choose the appropriate climate parameter from the drop down list to view the selected maps. Each of the images can be viewed individually or as an animated sequence. Users can scroll through the images by using the step left and step right buttons. Alternatively, the images can be viewed as an animated sequence by clicking the play button. To stop the animated sequence, click on the stop button. Below is a list of parameters that can be viewed as Maps for the past 14 days (recent weather) or for the next 14 days (forecast).
| Recent 14 Day Maps | Forecast 14 day Maps |
|---|---|
| Daily Rainfall | Daily Rainfall |
| Cumulative Rainfall | Cumulative Rainfall |
| Maximum Temperature | Maximum Temperature |
| Minimum Temperature | Minimum Temperature |
| Relative Humidity | Relative Humidity |
| Evapotranspiration |
An Example of a Recent Weather Daily Minimum Temperature map viewed in Spraywise Decisions
An Example of a Daily Cumulative Forecast Rainfall map viewed in Spraywise Decisions
Mobile technology improves very quickly so we have built a version Spraywise to take advantage of these new features on offer. Whether you use an iPhone, iPad, Android device or other smart phone or tablet, our new site should provide fast and simple access to all the features of Spraywise Decisions.
For those devices with built in GPS, the mobile site can access your current location and display information directly for it. This means no matter where you find yourself, as long as you have your mobile and reception, you will be able to effectively assess spraying conditions.
The mobile site offers all the features of the standard site, just in a simpler-to-access layout designed for hand held devices. Adding new locations and utilising the climate tools can be done effectively, and you can even register or resubscribe to the site all on your mobile.
If you have an iPhone or iPad you can save the web application to your home screen. Simply choose this option from your context menu and you will create an icon on your phones home screen allowing fast and full screen access to the Spray Planner.
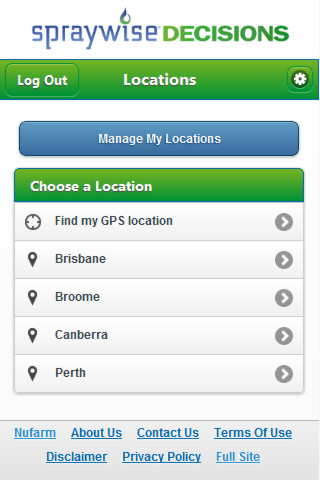
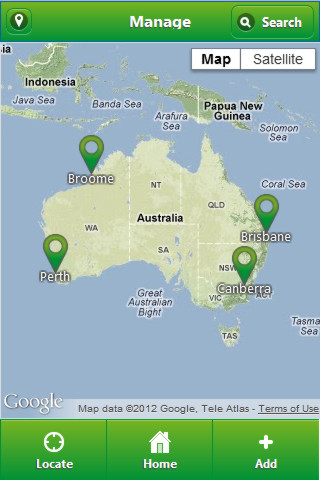
Select your location
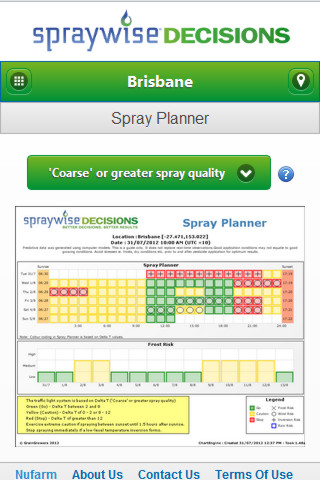
Access the Spray Planner
Manage your locations
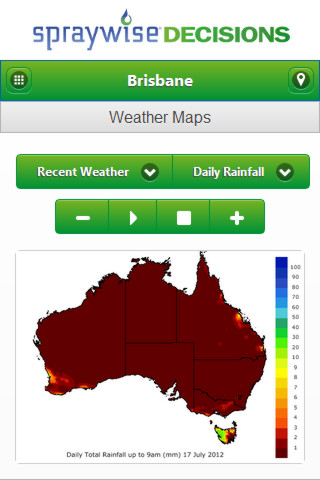
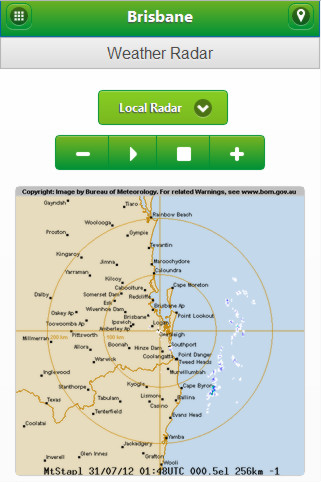
Weather radar information
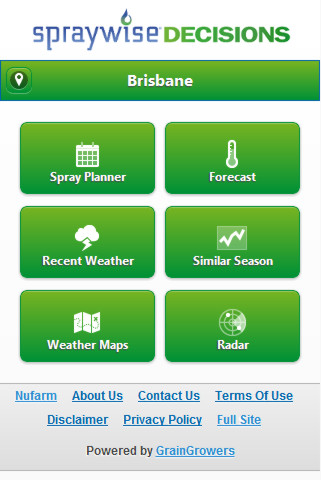
SprayWise tools suite
Weather maps